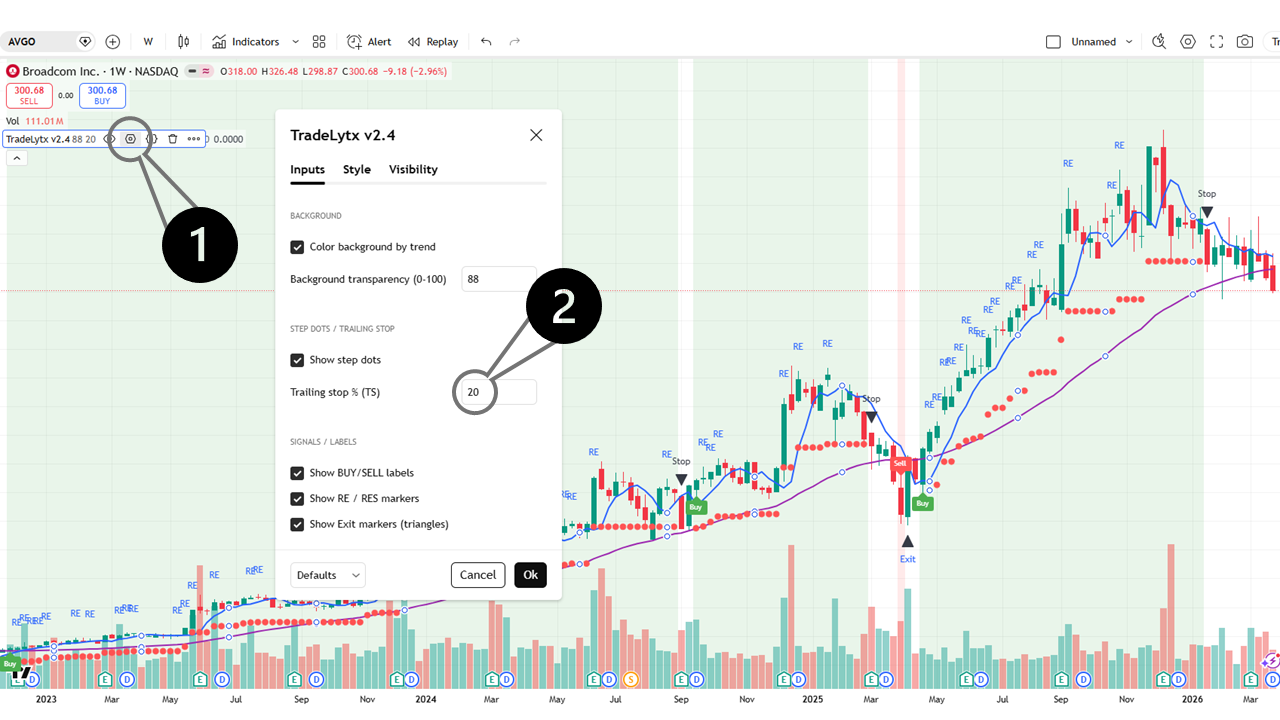
Signals on the weekly chart
1
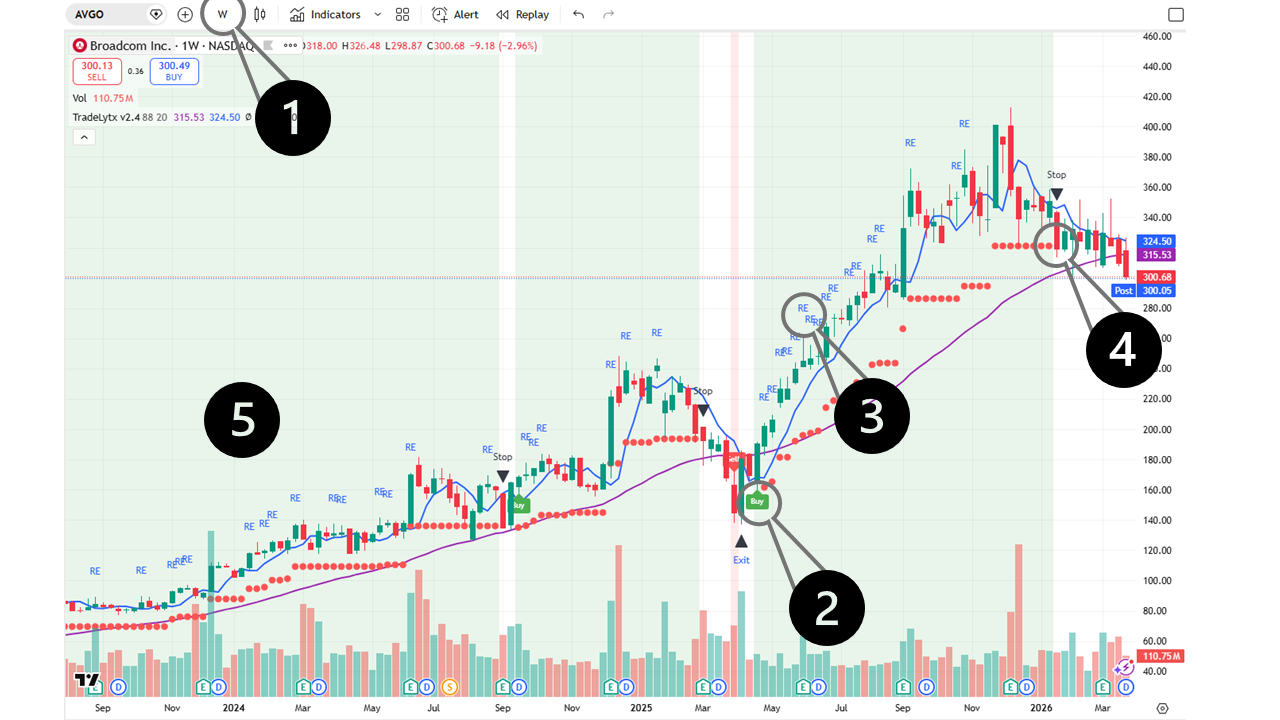
Always use the Weekly (W) view
TradeLytx is designed for the weekly timeframe. Switch your TradingView chart to "W" for reliable signals — daily charts generate too much noise.
2
Buy signal — your entry point
A green Buy label marks the optimal moment to open a position. The trend has just turned positive and momentum is building.
3
RE — Re-entry signal
Missed the initial Buy? A RE (Re-entry) label offers a second chance to join an ongoing uptrend at a confirmed support level.
4
Stop signal — protect your gains
A red Stop label appears when the price falls through the stop-loss level — by default 20% below the highest closing price since entry. Time to exit.
5
Background color — trend at a glance
A green background means the stock is in a positive trend — stay invested. A red background signals a negative trend — stay on the sidelines.